

MARKET BRIEF: Crypto Technical Analysis for Short-Term Moves
Top line: Crypto technical analysis helps traders turn wild price swings into clear trade signals.
Ever wonder if you could forecast crypto's rapid moves? This method uses price charts and candlestick patterns to highlight key trends in real time. It is like having a simple map that shows you where the short-term opportunities lie.
How it works: The approach transforms chaotic price action into clear signals using tools such as moving averages (the average price over a set period) and the Relative Strength Index (RSI, a momentum indicator). Even if you are new to trading or a seasoned pro, understanding these tools can reveal smart market moves in the fast world of crypto trading.
So what: By learning to read these signals, you can better plan your trades and quickly adapt to the market's ever-changing landscape.
What to watch: Keep an eye on key levels from moving averages and RSI readings as potential entry or exit points.
Crypto Technical Analysis: Bold Market Momentum
Top line: Crypto technical analysis gives you a real-time snapshot of market activity using price charts. So what: Traders can spot short-term opportunities quickly by studying chart patterns.
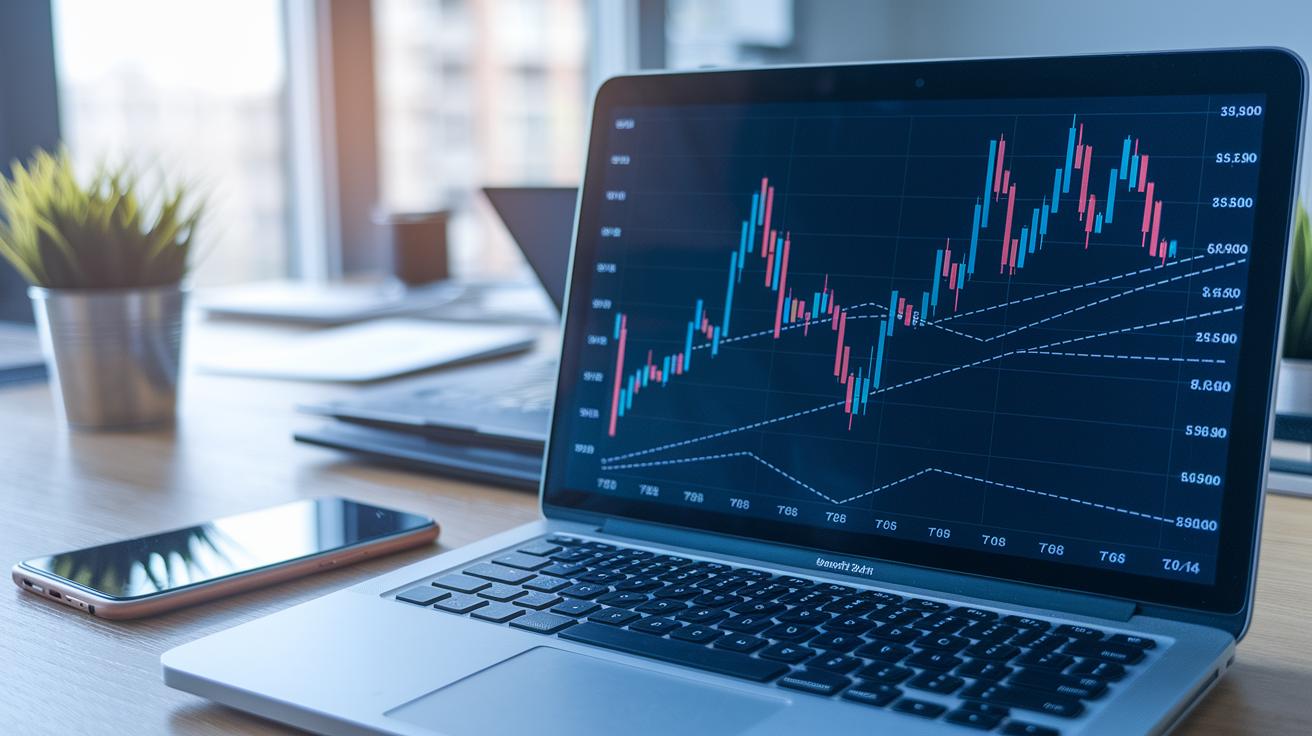
Crypto technical analysis relies on current price charts that show open, close, high, and low prices for each candlestick. By examining these price bars, traders get a clear picture of market conditions. (For more on this method, see the guide on technical analysis.)
Given that crypto assets often swing dramatically in just minutes, every candlestick pattern can point to a shift in market mood. Moving averages help smooth out wild price changes, while the Relative Strength Index (RSI, which tracks if an asset is overbought or oversold) operates on a scale from 0 to 100, with 50 as neutral. Together, these tools offer a fast, practical view of market dynamics.
Key elements of crypto technical analysis include:
- Reading price action and interpreting candlestick patterns
- Analyzing trading volume
- Drawing trend lines
- Identifying support and resistance levels
- Using key indicators like moving averages and the RSI
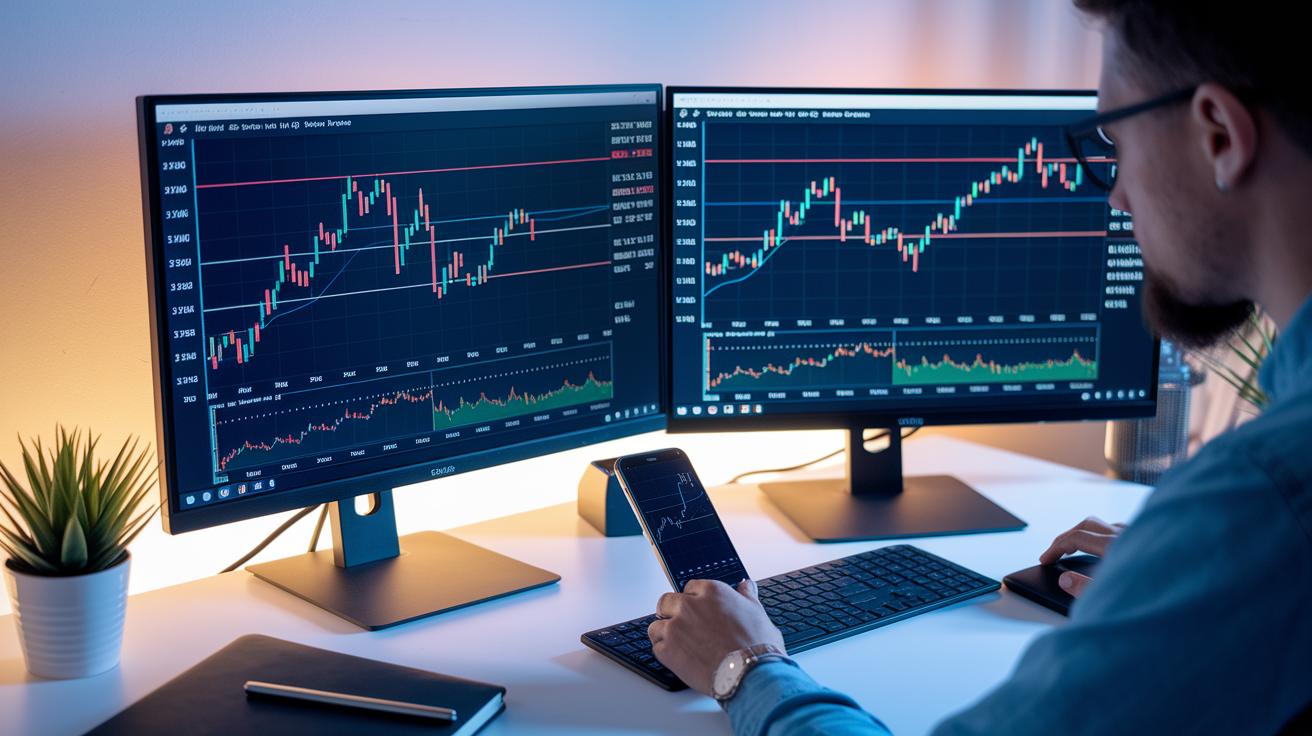
For those new to trading, free chart platforms such as TradingView and demo trading accounts allow you to practice without risking money. These resources provide live charts and simple explanations of the basics, making it easier to learn how to read charts and spot patterns before trading active positions in volatile markets.
Essential Crypto Chart Patterns for Technical Analysis

Head and Shoulders Pattern
This classic reversal setup appears when a price makes a first peak, then rises to create a higher peak, and finally drops to form another lower peak. In short, the chart shows a head with two shoulders. Traders watch for a break below the support line (often called the neckline) together with higher trading volume. This break signals a possible downward move.
Triangle Patterns (Ascending, Descending, Symmetrical)
Triangles occur when prices settle into a narrow range during consolidation. In an ascending triangle, the top stays flat while the lows rise, hinting at a bullish breakout. In a descending triangle, the bottom remains flat while the highs drop, which may lead to a bearish move. A symmetrical triangle forms when the trend lines converge evenly, allowing a break in either direction. Visualize the price squeezing between two lines until a sharp move occurs.
Double Top & Double Bottom
A double top happens when prices hit two similar peaks, marking a resistance zone and a possible turn downward. In contrast, a double bottom shows two nearly equal lows, suggesting strong support and the chance for a rise. For example, traders see a pair of highs followed by a decline, and if support holds during a second dip, it often triggers a buying signal.
Flags and Pennants
Both flags and pennants are short-term patterns that signal a pause during a strong move. Flags appear as small, rectangular ranges that slope against the prevailing trend. Pennants look like tiny, symmetrical triangles. They both typically indicate that the current trend will continue after the brief consolidation.
Cup and Handle
The cup and handle is a bullish continuation pattern. It looks like a rounded cup followed by a small dip, or handle, before the price moves higher again. The cup indicates a period of consolidation, and the handle represents a minor pullback. Once the price gathers strength, traders expect the upward trend to resume.
Key Indicators for Crypto Technical Analysis
Indicators help cut through market noise in crypto and reveal trends that matter. They let traders quickly spot changes in momentum and possible reversal signals in a fast-moving market.
For example, moving averages update with every new price. They smooth out the data to show the overall trend. The Relative Strength Index (RSI) works on a scale from 0 to 100 and flags when an asset may be overbought or oversold. On-Balance Volume (OBV) gives extra weight to upward price moves, which can highlight divergences that might otherwise be missed. The Awesome Oscillator (AO) finds the gap between two moving averages to pick up subtle shifts in momentum before a clear move happens.
| Indicator | Purpose | Signal |
|---|---|---|
| Moving Averages (MA) | Identify trend direction | Crossover for buy/sell |
| Relative Strength Index | Gauge overbought/oversold levels | RSI >70 overbought, <30 oversold |
| On-Balance Volume (OBV) | Track volume flow vs. price movement | Divergence signals |
| Awesome Oscillator (AO) | Detect momentum shifts | Zero-line crosses |
Mixing these indicators lets traders confirm signals instead of acting on a one-off move. For example, a moving average crossover paired with a rising RSI and OBV divergence can strengthen an entry signal. This combined approach lets you double-check both trend and momentum, improving the precision of your trading decisions in rapid crypto markets.
Integrating Trend Lines and Support/Resistance in Crypto Technical Analysis
Trend lines are created by joining clear turning points (swing highs or lows) on a price chart. They show market direction by linking moments when the price changes course. For example, drawing a line through the lows in an uptrend can reveal a rising support line, meaning buyers are consistently stepping in.
A strong trend line needs at least 2 or 3 touchpoints to work well. It shouldn’t be too steep or too flat so that it accurately reflects market sentiment. Adding too many points can hide short-term moves, while too few points make it less reliable. Adjust the trend line only when the price consistently supports a new level.
Support and resistance levels are fixed price areas where buying or selling pressure usually stops price moves. Support is like a floor where buyers tend to enter, while resistance acts as a ceiling where sellers take over. Prices often rebound off support or stall at resistance, creating clear trade opportunities.
It is important to tell real breakouts from fake ones. A genuine breakout usually comes with higher volume (more trading activity), indicating strong market participation. In contrast, a false breakout shows low volume and little conviction, which often leads to a reversal. Keeping an eye on volume helps you decide if a breakout can carry forward.
Advanced Charting Techniques and Fibonacci Levels in Crypto Technical Analysis
Fibonacci retracement and extension levels help crypto traders spot where prices might reverse during a BTC/USD swing. For example, if BTC moves from $50,000 to $60,000 and then drops, drawing retracement levels at 23.6%, 38.2%, and 61.8% shows spots where buyers could step in or sellers might exit. Extensions go a step further by indicating where prices could top after a bounce, such as when a trader sees the price stall near the 61.8% extension level.
Pivot Points add structure by marking key support and resistance areas. The basic pivot is calculated as (High + Low + Close) divided by 3. Fibonacci Pivot Points build on this by applying Fibonacci ratios to create extra levels. Woodie pivots use a modified formula that puts extra weight on the closing price, offering a different view. Using these tools gives traders a clear picture of potential turning points on the chart.
Multi-timeframe analysis links the bigger picture with precise entry points. By matching a clear daily trend with shorter charts like 1-hour or 4-hour setups, traders can pinpoint better entry moments. For instance, if the daily chart shows a strong upward trend, a pullback on an intraday chart identified by Fibonacci retracement might be a good chance to enter. This approach helps traders stay aligned with the overall market while taking advantage of short-term corrections.
Risk Management and Practical Examples for Crypto Technical Analysis
Keeping your losses small is crucial for long-term success in crypto trading. Every trade should match your risk tolerance by sizing your positions wisely. By risking only a small part of your capital, you reduce the impact of sharp price moves that can come from events like blockchain upgrades or changes in policy.
Effective risk management starts with setting stop-loss orders. You can place stops near clear support levels on your charts or use tools like the average true range (ATR, a measure of market volatility) to adjust for normal price swings. The Parabolic SAR helps signal potential trend reversals, so you know when to move your stop-loss closer to current price action.
Planning your profit targets is just as important. Use methods like Fibonacci extensions to estimate how far prices might go. This approach lets you set take-profit levels to lock in gains before the market reverses, ensuring you maintain a healthy risk/reward balance.
For example, during a BTC rally reversal, a trader might wait for a brief breakout to fade, then enter the market. The stop-loss would be set just below a strong support level, while Fibonacci targets indicate a reasonable exit zone. In another case, during an ETH triangle breakout, a trader might spot a consolidation pattern before a price surge. Here, the entry occurs at the breakout, the stop is determined using the ATR method, and previous resistance levels help pinpoint the profit target.
Final Words
In the action, we broke down crypto technical analysis fundamentals, from reading candlestick charts and drawing trend lines to spotting key support/resistance levels and leveraging indicators like RSI and MA. We also explored advanced techniques such as Fibonacci levels and multi-timeframe setups.
This guide wraps up practical strategies proven on live trading charts. Use these insights to spot high-probability trades while smartly managing risk. Keep applying these techniques, and you'll boost your trading confidence in volatile markets. Enjoy the process and stay positive.
FAQ
Where can I find crypto technical analysis books and PDFs?
Crypto technical analysis books and PDFs offer detailed guides on reading candlestick charts, moving averages, and RSI. You can find them through reputable finance sites and online libraries.
Where can I access free crypto technical analysis courses and materials?
Free crypto TA courses and materials provide beginner-friendly guides, live chart examples, and step-by-step analyses, often available on educational platforms and via trading software like TradingView.
What is the best crypto technical analysis website?
The best crypto TA websites combine live charts, in-depth tutorials, and interactive tools. Platforms like TradingView are popular for providing real-time data and detailed chart analysis.
What does crypto technical analysis for beginners involve?
Crypto technical analysis for beginners covers chart patterns, key indicators, and basic trend lines. It simplifies market data into clear signals to help new traders make informed decisions.
Which type of technical analysis works best for cryptocurrencies?
Crypto technical analysis works best when it combines price action, trend lines, and key indicators such as moving averages and RSI to account for the market’s rapid price swings.
Does technical analysis work on crypto assets?
Technical analysis on crypto assets works by using historical price patterns and support/resistance levels. It can help traders identify potential entry and exit points in volatile markets.
Is there any crypto expected to give 1000x returns?
Expecting any crypto to deliver 1000x returns is highly speculative. While technical analysis can suggest market trends, actual outcomes depend on various unpredictable market forces.
